Chart & Analysis Tools
Overview
The E8 Markets chart area is powered by TradingView and supports a full suite of technical analysis tools, indicators, drawing tools, and keyboard shortcuts.
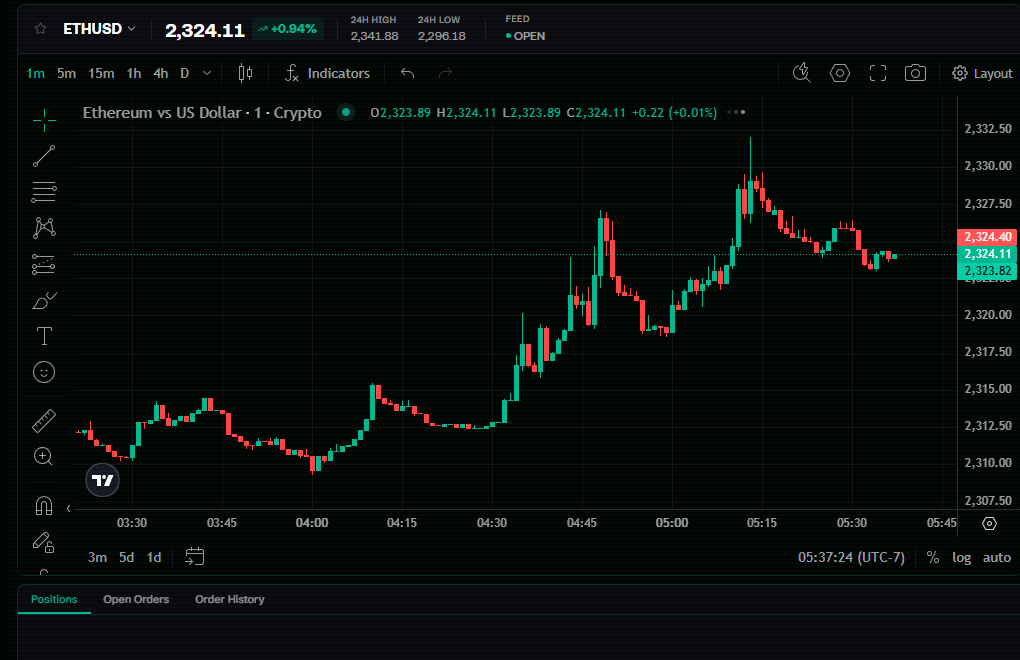
The chart area includes timeframe controls, indicators, drawing tools, layout controls, and live price markers.
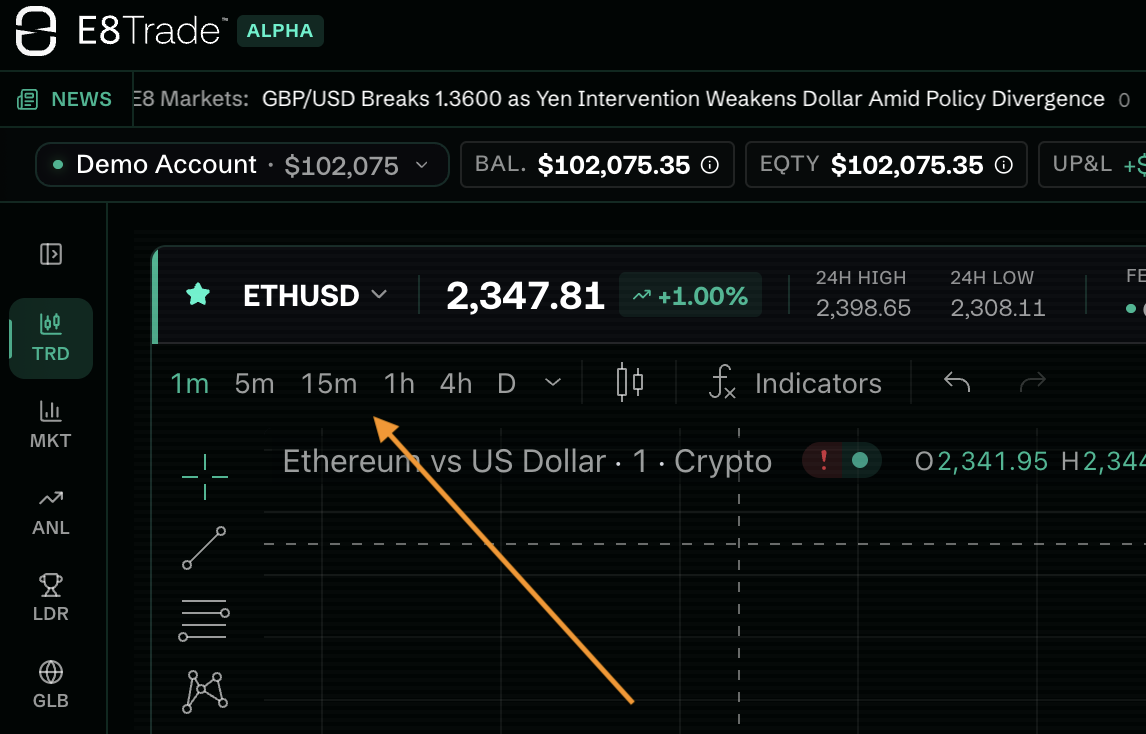
Q: How do I change the chart timeframe (interval)?
A: Use the interval selector at the top of the chart: 1m, 5m, 15m, 1h, 4h, 1D. You can also use your keyboard number keys to switch intervals quickly — press the corresponding number while the chart is in focus (e.g., 1 for 1m, 2 for 5m).
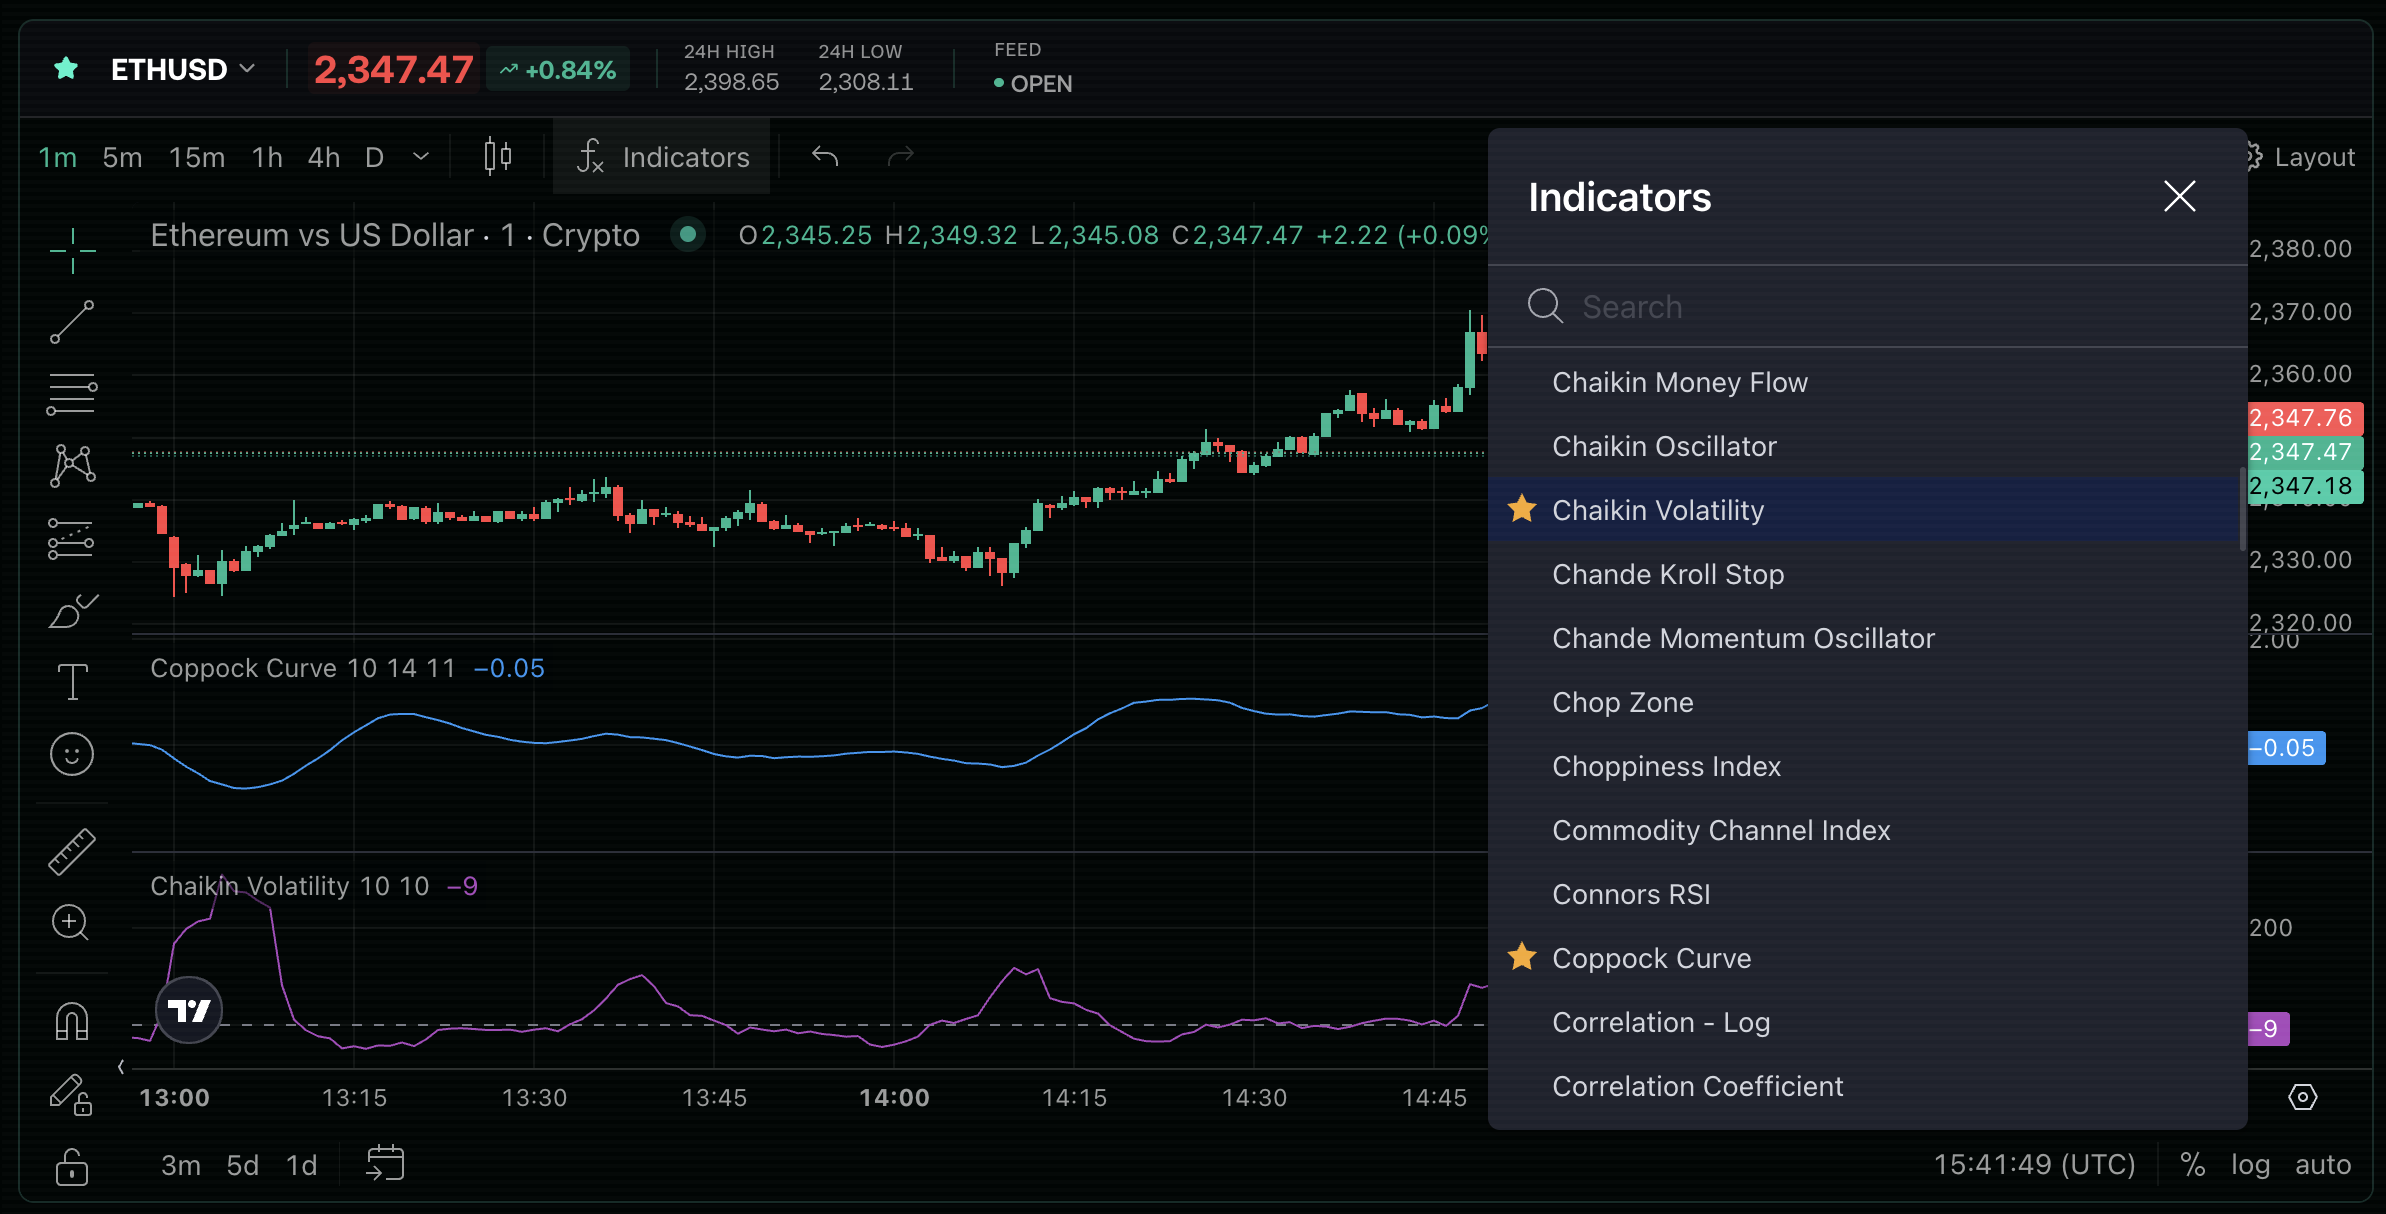
Q: How do I add indicators to the chart?
A: Press the / (slash) key on your keyboard to open the Indicators, Metrics & Strategies panel. Search for any indicator (e.g., RSI, MACD, Bollinger Bands) and click to apply it. You can also access indicators via the Indicators button in the chart toolbar at the top.
Q: What drawing tools are available?
A: The drawing toolbar (left side of the chart) includes:
- Trend Line — draw support/resistance lines
- Fib Retracement — Fibonacci levels from swing high to low
- XABCD Pattern — harmonic pattern tool
- Long Position — visualize trade setup with TP/SL zones
- Brush — freehand drawings
- Text Annotations — add custom labels to the chart
- Magnet Mode — snaps drawings to the closest OHLC price value
Q: What keyboard shortcuts are available in the terminal?
A: The following shortcuts speed up your workflow:
| Shortcut | Action |
|---|---|
⌥ + Z |
Enable keyboard navigation mode |
⌘ + K |
Quick search (symbol search) |
| Type symbol name | Change the active symbol |
| Number keys (1–6) | Change chart interval |
/ (slash) |
Open Indicators panel |
. (period) |
Load a saved chart layout |
Q: How do I save and load chart layouts?
A: Use the Save button in the chart toolbar to save your current chart layout (indicators, drawings, settings). To load a previously saved layout, press the . (period) key or use the Manage Layouts option in the same toolbar.
Q: Can I take a snapshot of the chart?
A: Yes — the Take a Snapshot option is available in the chart toolbar (top right of the chart area). This saves an image of the current chart view, which you can share or reference later.
Use the chart toolbar for snapshots, layouts, indicators, and visual analysis tools.